PaperBanana: Google teaches AI to draw charts that won't embarrass you in front of reviewers
Google and Peking University have unveiled PaperBanana, a multi-agent system for producing academic illustrations. LLMs have handled text and code reasonably well, but visualizing complex methodologies has remained their Achilles' heel. PaperBanana chains together agents that design, code, and render the graphics. Rather than simply generating images, it produces publication-ready diagrams and statistical charts in formats such as PDF or SVG. For researchers, that could end hours-long sessions in graphics editors. The output quality is comparable to a professional designer's work, which effectively closes the last gap in the vision of a fully autonomous research cycle.
AI-processed from MarkTechPost; edited by Hamidun News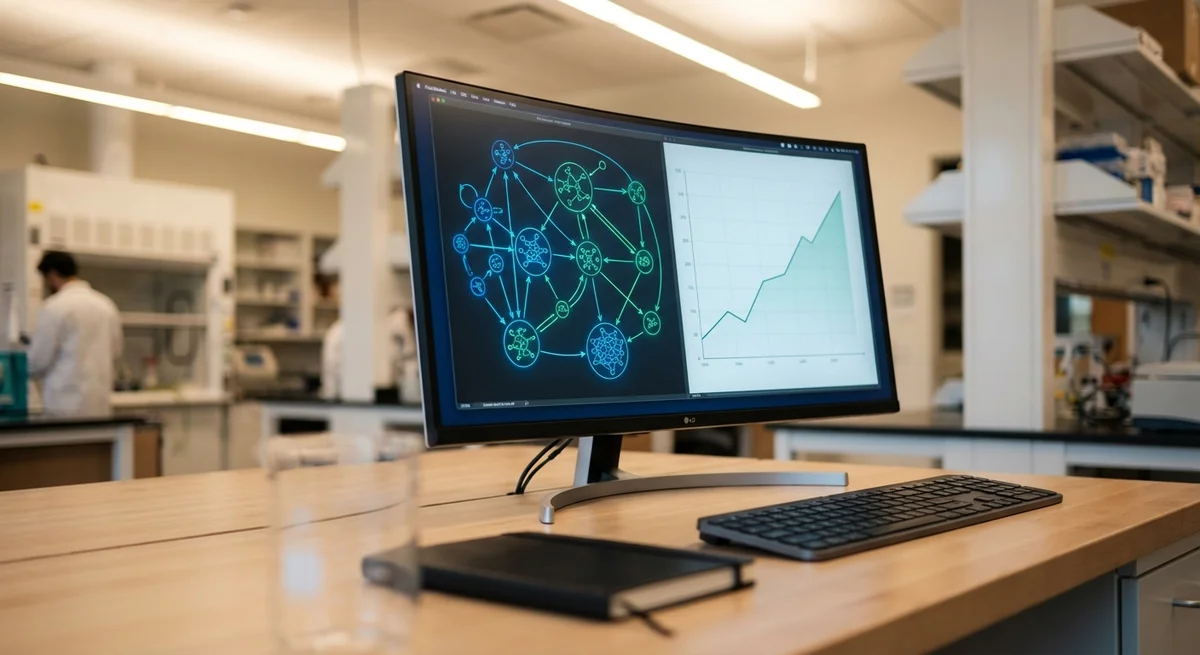
Google and Peking University have introduced PaperBanana, a multi-agent framework that automates the creation of methodology diagrams and statistical charts for scientific publications. MarkTechPost reported the development.
The problem with scientific visualization
A scientific chart has to be accurate, scalable, and compliant with strict publication standards. General-purpose generative models like DALL-E aren't suited to the job: they hallucinate data and don't understand the logic of an experiment. Until now, automation in science has mostly covered text and computation — neural networks have learned to write literature reviews, propose hypotheses, and write code — but visualizing results remained manual work.
How PaperBanana works
Instead of handing the drawing to a single model, PaperBanana splits the task among specialized agents: one plans the diagram's structure, a second writes the code to render it, and a third critiques the result, checking whether the axes are mixed up and whether the fonts are legible. The hierarchy mimics how a small design studio operates.
Context: tools for AI research
Projects like Sakana AI's AI Scientist have already shown that a neural network can take research from idea to draft paper, but those efforts stumbled at the visualization stage. Google, which competes with OpenAI and Anthropic on tools for developers and scientists, is closing that gap with a framework aimed at an academic audience.
Open questions on ethics and quality
If a paper is entirely AI-generated, including its data visualizations, how are reviewers supposed to verify that the data is genuine? PaperBanana builds its charts from real numbers, but the sheer ease of producing them could trigger a flood of low-quality, "nicely packaged" publications.
What does PaperBanana do?
PaperBanana is a multi-agent framework from Google and Peking University that automates the creation of methodology diagrams and statistical charts for scientific publications.
Why aren't general-purpose generative models like DALL-E suitable for
scientific charts?
They hallucinate data and don't understand the logic of an experiment, whereas a scientific chart has to be accurate, scalable, and compliant with strict publication standards.
How are roles divided among the agents in PaperBanana?
One agent plans the diagram's structure, a second writes the code to render it, and a third critiques the result, checking whether the axes are mixed up and whether the fonts are legible.
- Nov 2, 2026Bun creator uses Claude Code to port 750K lines from Zig to Rust in 11 days
- Nov 2, 2026The Verge reviewer builds a $50 Meta Muse Charm alternative with Claude Code
- Nov 1, 202616 models tested on 7 search tools: Exa averaged 10.5 out of 14, SearXNG about 3
- Nov 1, 2026Google's StreamVibe video agent beats other models by 10.7% on response timing and quality
Key Questions Answered
What does PaperBanana do?
PaperBanana is a multi-agent framework from Google and Peking University that automates the creation of methodology diagrams and statistical charts for scientific publications.
Why aren't general-purpose generative models like DALL-E suitable for scientific charts?
They hallucinate data and don't understand the logic of an experiment, whereas a scientific chart has to be accurate, scalable, and compliant with strict publication standards.
How are roles divided among the agents in PaperBanana?
One agent plans the diagram's structure, a second writes the code to render it, and a third critiques the result, checking whether the axes are mixed up and whether the fonts are legible.
Test Frontier LLMs & Autonomous Agents in One Workspace
Run Claude Opus 5.5, GPT-6, Gemini 3.1, and DeepSeek side-by-side in Nomad AI (nomadnet.ai) — unified model routing, deep research, and multimodal workflows under one subscription.
The AI world, distilled — once a week
Seven stories that actually mattered, hand-picked. No noise, no reposts, no press releases.
Done! Check your inbox for a confirmation.